Showing posts with label code. Show all posts

Monday, May 15, 2017

Why Logistic Regression is linear even though it uses a non linear function

Logistic Regression uses a non linear activation function - the logistic function:

\[z = \frac{1}{(1 + e^{-y})}\]

where $\textit{y}$ is linear in $\textit{x}$, the input variable.

Note that this is equivalent to:

\[z = \frac{e^{y}}{(1 + e^{y})}\]

So why is logistic regression considered linear and the result used for classification rather than predicting a continuous output? Having more of a computer science background, this was something that did not initially catch my eye. This related post made it quite easy for me to understand logistic regression. Here I provide some key points related to logistic regression and some references from a theoretical perspective to help develop a better understanding:
  • Logistic function is used to give the probability of the output being in a binary class. Its output is always between 0 and 1 given any value of inputs in any number of dimensions.
  • If you rearrange the logistic function, the natural log of the odds (the ratios of probabilities of an event being successful and unsuccessful) is the familiar linear regression equation. The reason why logistic regression is considered linear is that we are combining the outputs using a linear function.
  • The tanh function, which is a mathematical function of the logistic function is a better choice than logistic function since it has steeper gradient. The steeper gradient is better in backprop training. A steeper gradient passes back feedback from output back to input much faster and having a larger impact on weights closer to input nodes making convergence faster.
  • While logistic regression works very well in binary classification for any number of dimensions, the softmax function is a much better choice for in multi-class classification. The softmax sums up to one in a multi-class situation over all the classes. The logistic function does not have this property. 
  • In a binary classification, using a softmax function is equivalent to using the sigmoid function.
  • One may ask why use these complicated exponential functions in the output? If we want probability, we can simply use an average - divide each output by the sum of outputs. The problem with this approach is that individual values can become negative even if they add to one. Exponentiating makes everything positive. Also, exponentiation works well for back propagation since it amplifies errors making algorithms converge faster.
  • The use of logistic function as an activation function inside the network also has an issue - the vanishing gradient problem which makes deep neural nets very hard to train. ReLU, y = max(x, 0), has been a popular choice since it does not alter the gradients as they are propagated back to the input. This nice blog entry provides a great explanation.
  • ReLU is also only used for hidden layers. Outputs would still be softmax (classification) or linear (regression).

Wednesday, May 10, 2017

Better ways to do One Hot Encoding

While running an ML algorithm on any data, you may have to convert categorical data into numerical data - reason is that a mostly all scikit-learn code requires you to input data which is numeric. Though one may think that it is a scikit limitation, that may not be true. Since ML uses math and vectors behind the scenes, the data has to be numerical for most good algorithms.

One of the common ways to convert categorical data to numeric data is using One Hot Encoding. This kind of encoding uses indicator variables, where each value of the category is replaced by a column of its own. This can lead to column explosion so one must be careful. A lot of times, categories that have an order can be mapped to numerical values that may be helpful as well. 

Several methods of One Hot Encoding have been mentioned. Most prominent and simple of them uses the get_dummies function in pandas:
In this function, we loop through all the categorical variables in the pandas dataframe one by one and for each case, we use get_dummies to create indicator variable columns (which are numeric) and then we delete the original categorical column. This is pretty simple and mostly this is what is recommended the most in forums. However, there are a few catches with this method in practice:

  1. The categorical variable may have different sets of values in training, validation and test data. If you run get_dummies, it may assign the same numeric value to different categorical values. When fed into the ML algorithm this can cause unintended data alternation and results.
  2. The order in which the categorical values are encountered by get_dummies may further contribute to the above issue
  3. Some categorical values may only appear in validation and test data and may be absent in training data. This can cause more problems. Training a model on one kind of values and then testing predictions on another may not make sense. The get_dummies does not help identify this problem. 
The best course of action is to map the categorical values to a set of indicator variables and then use the same set during test and validation. This should not be changed. In addition, if certain categorical values that are going to be seen in practice in validation or test data, we must take that into account. We will leave this specific problem to another post. In this post, lets see how we can fix get_dummies to at least fix the first two problems and alert us of the third one.

Python provides few other alternatives that are a bit complex to use but I feel are totally necessary. One of these uses the LabelEncoder function. LabelEncoder looks at a categorical variable and creates a transformation which maps the values to integer labels. This does not create any indicator variables so one may think is inadequate for our needs. However, what LabelEncoder does is store the mapping as a model which can be used repeatedly later on. Combining LabelEncoder with get_dummies provides the ideal solution:
So what's up with the dictionary and the train variable in this function? Note our initial objective - we must use the same mapping for both the training and test data. The python dictionary holds important storage area for the mappings created by the LabelEncoder for each column in a dataframe. The call made to this function for training data looks as follows:

train_data, le_dict = oneHotEncode2(train_data)

Then on the test data, the call is made by passing the dictionary returned back from training:

test_data, _ = oneHotEncode2(test_data, le_dict)

The call to an already created transform for encoding also checks to see if it encounters any new values in the test data. If it does, it will warn us and we can go back and take appropriate action.

Monday, May 8, 2017

Hail Seaborn!

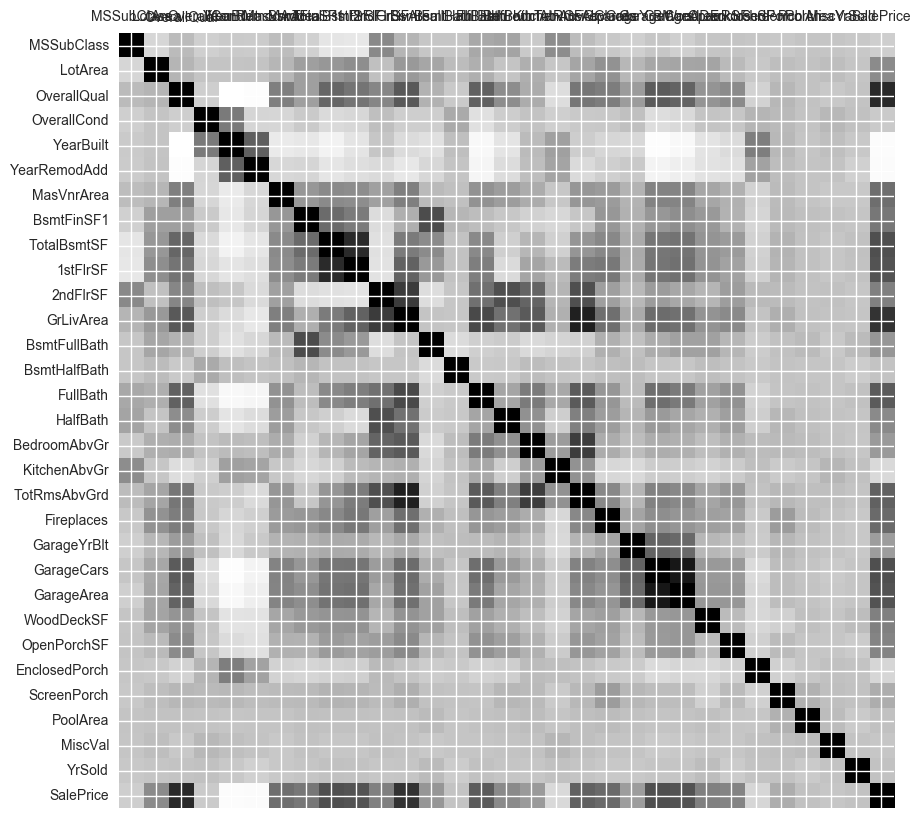
The seaborn heatmap perhaps is the best visualization of the correlations in a data set.


 Much better than Axes.matshow():


Analyzing Predictions to find *bugs*

Testing should be one of the most frequent steps in the SDLC for any code, whether it is building a website, powering a smart device or machine learning. Tests of machine learning code may reveal lots of issues - transformations that don't work because the right columns are not operated on or data which fails assumptions of the learning algorithm. The list may be endless and we are well attuned to this process. One of the tests often ignored is comparing the test results during the training period with actual values from the data and then trying to find what went wrong and where. This can often reveal attributes or column values that you may have ignored till now and must play a bigger role.

For example, use the following function to plot test results against the real values. The plot should be a straight line. Any deviations from it are to be analyzed for every column.


Make your test data comply with training data

When using scikit-learn libraries with pandas, you would often get errors if the test data does not have columns which match the model created from the training data set. You may have deleted columns that you did not need from the training data when creating the model or you may have constructed new columns based on existing data variables (for example, creating 'Age' from 'Date' or combining the effects of multiple variables). In most cases, this is simple to achieve by wringing the test data through the same function as the training data. However, when you are using One-Hot-Encoding of categorical data, the columns created as a result of this coding in the training set and the test set may not match for the simple reason that some values for categorical data may only be present in the training data set and others may be present only in the test data set. I have included here a python function that I wrote and works really well to match the test data with the training data:


Thursday, January 26, 2017

K-Means Cluster Analysis on Outlook on Life Survey Data

The Outlook on Life Survey (OOL) was designed to study political and social attitudes in the United States. The project included two surveys fielded between August and December 2012 using a sample from an Internet panel. A total of 2,294 respondents participated in this study during Wave 1 and 1,601 were interviewed during Wave 2. There are 436 variables in this study.

Note that full access to data archive is available for members on the ICPSR site.

Our goal in this study is to do a K-Means Cluster Analysis to determine if there is a set of variables we can identify that can measure how angry people feel about the way things are going in the country these days (W1_B4).

The variables we selected as the cluster variables are:

Variable Description
W1_H1       Society has reached the point where Blacks and Whites have equal opportunities for achievement
W1_O5       [Black people should teach their children to be careful around the police] How much emphasis or de-emphasis should Black people place on each statement in the education of their children?
PPINCIMP   Household Income
W1_F4_D         [To become wealthy ] For yourself and people like you, how easy or hard is it to reach these goals?
W1_F6       How far along the road to your American Dream do you think you will ultimately get on a 10-point scale where 1 is not far at all and 10 nearly there?
W1_M5     How often do you attend religious services?


We are going to validate our clusters by excluding the variable W1_B4 (Description - Generally speaking, how angry do you feel about the way things are going in the country these days?) from our analysis. We would treat this variable as a measure and we expect to see some differences on this variable amongst our clusters.

While doing the cluster analysis we noticed the following: (a) In some cases, when more data was included for determining the clusters or the cluster analysis was repeated, we observed that the cluster means for our measure variable came quite close. In addition, if the number of clusters we wanted was increased, that also had an impact on the cluster means and the significance of the difference amongst the cluster means.

First, we ran a simulation trying to determine what the affect of clustering on the average distance of the points from centroids. For our analysis, we will go with three clusters. As we can see the choice of number of clusters is completely subjective. As the number of clusters increase, the average distance will decrease.


Here is the plot of the cluster after applying PCA to reduce the number of variable dimensions to two:


The split amongst the three clusters is (the cluster IDs are 0.0, 1.0 and 2.0)

0.0    419
2.0    355
1.0    348

Our next step is to try and fit a simple least squares line using W1_B4 as the dependent variable based on the cluster number we have determined for the points. The results of that are:


The mean and standard deviation for W1_B4 in the three clusters are:

cluster        
0.0      2.916468
1.0      3.129310
2.0      3.008451
standard deviations for W1_B4 by cluster
            W1_B4
cluster        
0.0      1.307026
1.0      1.192171
2.0      1.224716

Because we had more than two clusters, we decided to conduct a tukey test to determine which one of the two means had significant difference. It seems that cluster 0.0 and cluster 1.0 had means that were significantly different (led to rejection of the null hypothesis).


Then we analyzed the two clusters are the means of the different cluster variables within those clusters.

The following is the mean of the various clustering variables in their respective clusters:


W1_B4 mean is lower for cluster 0.0 indicating that people in cluster 0.0 are generally more angry about the situation in the country than those in cluster 1.0 (lower values in the survey correspond to higher anger felt by the respondent). Then we try to look deeper into the cluster variable means. We find that W1_F4_D is lower for cluster 0.0. Lower value indicates that the respondents think that it is hard to become wealthy in this country. A lower value of W1_H1 (in cluster 0.0) indicates that the respondents agree much more that blacks and whites have equal opportunities for achievement. A lower value of W1_M5 for cluster 0.0 also indicates that respondents attend religious services more frequently there. A higher value for W1_05 for cluster 0.0 indicates that respondents place a strong emphasis that black people should teach their children to be careful around the police in the education of their children. Cluster 0.0 also has lower average household income.

So what can we establish - it seems that the likelihood that a person is going to be unhappy about the situation in this country is going to be higher when their income is lower and they generally do not believe that their wealth can significantly increase in this country (even though they believe that blacks and whites have equal opportunities). The higher likelihood seems connected with lower income, more religious bent of mind and general wariness of law enforcement.

The code is included below:


Sunday, January 22, 2017

Lasso Regression for U.S. National Epidemiological Survey on Alcohol and Related Conditions (NESARC) data

Background on the data used here (NESARC) was described in an earlier post in this blog. In that post, we conducted a Random Forest analysis for the boolean response variable: EVER GAMBLED 5+ TIMES IN ANY ONE YEAR (S12Q1). In this post we conduct Lasso Regression for the same. Before we dive into the analysis, there were some interesting observations about using Lasso, which performs linear regression for a response variable. When this response variable has an integer value vs a boolean we get different results. When we use a boolean variable, the results are quite similar to the Random Forest analysis which also used a boolean response variable. However, if we use an integer value for the response variable, which makes more sense to use in a linear regression (e.g Lasso where MSE is calculated), the list of important variables detected are different from those reported by Random Forest. This requires more analysis.

The following variables (listed below in order of importance) were identified as the most important since their coefficients were the largest in absolute values in this regression. We can compare the coefficients since we scaled the input variables to zero mean and unit variance. The most important variables identified in this analysis were: whether the individual had panic attacks (S6Q1) or was engaged in reckless driving (S11AQ1A15) or was not too open with anyone including those close to him/her (S10Q1A3). The rest of the variables are mentioned as well. The variables whose coefficient was reported to be zero by Lasso are briefly mentioned below as well.


Variable Description Coefficients
S6Q1       HAD PANIC ATTACK, SUDDENLY FELT FRIGHTENED/OVERWHELMED/NERVOUS AS IF IN GREAT DANGER BUT WERE NOT 0.226163
S11AQ1A15   EVER GET MORE THAN 3 TICKETS FOR RECKLESS/CARELESS DRIVING, SPEEDING, OR CAUSING AN ACCIDENT 0.175727
S10Q1A3     FIND IT HARD TO BE "OPEN" EVEN WITH PEOPLE YOU ARE CLOSE TO 0.125577
S11AQ1A25   EVER DO SOMETHING YOU COULD HAVE BEEN ARRESTED FOR, REGARDLESS OF WHETHER YOU WERE CAUGHT OR NOT 0.085541
S11AQ1A2   EVER STAY OUT LATE AT NIGHT EVEN THOUGH PARENTS TOLD YOU TO STAY HOME 0.068325
S11AQ1A22   EVER SHOPLIFT 0.067515
S11AQ1A1   OFTEN CUT CLASS, NOT GO TO CLASS OR GO TO SCHOOL AND LEAVE WITHOUT PERMISSION 0.067146
S11AQ1A14   EVER DO THINGS THAT COULD EASILY HAVE HURT YOU OR SOMEONE ELSE, LIKE SPEEDING OR DRIVING AFTER HAVING TOO MUCH TO DRINK 0.054445
S9Q1A       EVER HAD 6+ MONTH PERIOD FELT TENSE/NERVOUS/WORRIED MOST OF TIME 0.047805
S10Q1A16   THE KIND OF PERSON WHO FOCUSES ON DETAILS/ORDER/ORGANIZATION OR LIKES TO MAKE LISTS AND SCHEDULES 0.047434
S1Q1G       NUMBER OF YEARS LIVED IN UNITED STATES -0.030454
SMOKER     TOBACCO USE STATUS 0.026548
S11BQ1     BLOOD/NATURAL FATHER EVER HAD BEHAVIOR PROBLEMS 0.024917
AGE         CYEAR (DATE OF INTERVIEW: YEAR) - DOBY (DATE OF BIRTH: YEAR) -0.024049
S2AQ5G     HOW OFTEN DRANK 5+ BEERS IN LAST 12 MONTHS 0.022640
S10Q1A25   HAVE OTHERS TOLD YOU THAT YOU ARE STUBBORN OR RIGID 0.019741
S3AQ3B2     USUAL FREQUENCY WHEN SMOKED CIGARS -0.015306
S1Q1D5     "WHITE" CHECKED IN MULTIRACE CODE -0.012658
S1Q10A     TOTAL PERSONAL INCOME IN LAST 12 MONTHS -0.012306
MARITAL     CURRENT MARITAL STATUS 0.011049
DGSTATUS   DRUG USE STATUS -0.009435
S3AQ3B1     USUAL FREQUENCY WHEN SMOKED CIGARETTES 0.008346
S1Q9B       OCCUPATION: CURRENT OR MOST RECENT JOB -0.007877
CHLD0_17   NUMBER OF CHILDREN UNDER AGE 18 IN HOUSEHOLD 0.007562
S2AQ10     HOW OFTEN DRANK ENOUGH TO FEEL INTOXICATED IN LAST 12 MONTHS -0.007253
S10Q1A43   ARE THERE VERY FEW PEOPLE YOU'RE REALLY CLOSE TO OUTSIDE OF IMMEDIATE FAMILY 0.007089

Variables reported with zero coefficents (these could be correlated with the variables mentioned above that have non-zero coefficents since Lasso would randomly end up picking one of the correlated variables) or unrelated with the response variable:


Variable Description Possible Explanation
S10Q1A52   THE SORT OF PERSON WHO DOESN'T CARE ABOUT WHAT PEOPLE THINK OF YOU Seems Correlated
S10Q1A58FLIRT A LOT Seems Correlated
S2AQ12F     HOW OFTEN DROVE MOTOR VEHICLE AFTER 3+ DRINKS IN LAST 12 MONTHS Seems Correlated
S10Q1A47   HAVE ALMOST ALWAYS PREFERRED TO DO THINGS ALONE RATHER THAN WITH OTHERS Seems Correlated
S10Q1A46   TAKE LITTLE PLEASURE IN BEING WITH OTHERS Seems Correlated
S10Q1A45   WOULD BE JUST HAPPY WITHOUT HAVING ANY CLOSE RELATIONSHIP Seems Correlated
S2AQ12B     HOW OFTEN DRANK AFTER MIDNIGHT IN LAST 12 MONTHS Seems Correlated
S10Q1A32   OFTEN GET ANGRY OR LASH OUT WHEN SOMEONE CRITICIZES OR INSULTS YOU Seems Correlated
S10Q1A22   HARD TO LET OTHERS HELP IF THEY DON'T AGREE TO DO THINGS EXACTLY THE WAY YOU WANT Seems Correlated
S2AQ9       HOW OFTEN DRANK 4+ DRINKS OF ANY ALCOHOL IN LAST 12 MONTHS (WOMEN ONLY) Seems Correlated
NUMPER18   NUMBER OF PERSONS 18 YEARS AND OLDER IN HOUSEHOLD Seems Unrrelated
NUMPERS     NUMBER OF PERSONS IN HOUSEHOLD Seems Correlated/Unrelated

The training and test R-square errors were reported as 0.670503947 and 0.66454160107 respectively which were fairly high indicating a good fit of the model with the training and test data. The training and test mean squared error was 0.474361978873 and 0.495379372341 respectively which was fairly low in both cases as well. The MSE plot is as follows and we can see that the MSE is successively going down as the alpha value increases.


The plot for the progression of the coefficients as the variables are added one-by-one in the Lasso Regression is show below.


Python code is included below:


Friday, January 20, 2017

Random Forest Analysis of U.S. National Epidemiological Survey on Alcohol and Related Conditions (NESARC) data

In 2001/2002, the National Institute on Alcohol Abuse and Alcoholism (NIAAA) conducted the National Epidemiologic Survey on Alcohol and Related Conditions (NESARC), the largest and most ambitious comorbidity (simultaneous presence of two chronic conditions in a patient) study ever conducted. In addition to an extensive battery of questions addressing present and past alcohol consumption, alcohol use disorders (AUDs), and utilization of alcohol treatment services, NESARC included similar sets of questions related to tobacco and illicit drug use (including nicotine dependence and drug use disorders).

The unprecedented sample size of NESARC (n = 43,093) made it possible to achieve stable estimates of even rare conditions. Moreover, its oversampling of Blacks and Hispanics as well as the inclusion of Hawaii and Alaska in its sampling frame yielded enough minority respondents to make NESARC an ideal vehicle for addressing the critical issue of race and/or ethnic disparities in comorbidity and access to health care services.

NESARC studies the occurrence of more than one psychological disorder or substance use disorder in the same person. In this analysis I have utilized the data collected in the survey for gambling and tried to determine its linkage to other predictors like alcoholic tendencies or drug use or other personality traits that can be detected. General information about the survey can be found here.

The following response variable was predicted: EVER GAMBLED 5+ TIMES IN ANY ONE YEAR (S12Q1).

The following variables (listed below in order of importance) were amongst those included as explanatory variables in Random Forest technique. The accuracy of the random forest was 74% with the maximum accuracy achievable with around 12 trees in the forest. Further increase in number of estimators (trees) did little to increase overall accuracy of the model. On closer examination of the variables found important by the model, we can see that an we can predict about the gambling tendencies of an individual by examining their alcohol consumption patterns, personality and drug use amongst other things.


Variable Description Score
S1Q1G       NUMBER OF YEARS LIVED IN UNITED STATES 0.059010
S1Q10A     TOTAL PERSONAL INCOME IN LAST 12 MONTHS 0.057991
AGE         CYEAR (DATE OF INTERVIEW: YEAR) - DOBY (DATE OF BIRTH: YEAR) 0.056678
S1Q1E       ORIGIN OR DESCENT 0.048400
S1Q9B       OCCUPATION: CURRENT OR MOST RECENT JOB 0.046075
BUILDTYP   TYPE OF BUILDING FOR HOUSEHOLD 0.036685
MARITAL     CURRENT MARITAL STATUS 0.029524
SMOKER     TOBACCO USE STATUS 0.028936
NUMPERS     NUMBER OF PERSONS IN HOUSEHOLD 0.027357
S2AQ12B     HOW OFTEN DRANK AFTER MIDNIGHT IN LAST 12 MONTHS 0.025185
S10Q1A52   THE SORT OF PERSON WHO DOESN'T CARE ABOUT WHAT PEOPLE THINK OF YOU 0.024643
S2AQ10     HOW OFTEN DRANK ENOUGH TO FEEL INTOXICATED IN LAST 12 MONTHS 0.024418
S10Q1A16   THE KIND OF PERSON WHO FOCUSES ON DETAILS/ORDER/ORGANIZATION OR LIKES TO MAKE LISTS AND SCHEDULES 0.023065
CHLD0_17   NUMBER OF CHILDREN UNDER AGE 18 IN HOUSEHOLD 0.022352
S10Q1A20   OTHERS THINK YOU HAVE UNREASONABLY HIGH STANDARDS/MORALS/IDEAS ABOUT RIGHT AND WRONG 0.022323
S10Q1A43   ARE THERE VERY FEW PEOPLE YOU'RE REALLY CLOSE TO OUTSIDE OF IMMEDIATE FAMILY 0.022088
S10Q1A25   HAVE OTHERS TOLD YOU THAT YOU ARE STUBBORN OR RIGID 0.021601
S11AQ1A2   EVER STAY OUT LATE AT NIGHT EVEN THOUGH PARENTS TOLD YOU TO STAY HOME 0.020961
NUMPER18   NUMBER OF PERSONS 18 YEARS AND OLDER IN HOUSEHOLD 0.020405
S11AQ1A1   OFTEN CUT CLASS, NOT GO TO CLASS OR GO TO SCHOOL AND LEAVE WITHOUT PERMISSION 0.020345
S10Q1A45   WOULD BE JUST HAPPY WITHOUT HAVING ANY CLOSE RELATIONSHIP 0.020180
NUMREL18   NUMBER OF RELATED PERSONS 18 YEARS AND OLDER IN HOUSEHOLD 0.019861
S2AQ5G     HOW OFTEN DRANK 5+ BEERS IN LAST 12 MONTHS 0.019397
S3AQ3B1     USUAL FREQUENCY WHEN SMOKED CIGARETTES 0.019338
S11BQ1     BLOOD/NATURAL FATHER EVER HAD BEHAVIOR PROBLEMS 0.018869
S10Q1A47   HAVE ALMOST ALWAYS PREFERRED TO DO THINGS ALONE RATHER THAN WITH OTHERS 0.018636
S11AQ1A25   EVER DO SOMETHING YOU COULD HAVE BEEN ARRESTED FOR, REGARDLESS OF WHETHER YOU WERE CAUGHT OR NOT 0.018017
S10Q1A22   HARD TO LET OTHERS HELP IF THEY DON'T AGREE TO DO THINGS EXACTLY THE WAY YOU WANT 0.017820
DGSTATUS   DRUG USE STATUS 0.017671
S1Q1D5     "WHITE" CHECKED IN MULTIRACE CODE 0.017200
S6Q1       HAD PANIC ATTACK, SUDDENLY FELT FRIGHTENED/OVERWHELMED/NERVOUS AS IF IN GREAT DANGER BUT WERE NOT 0.016674
S11AQ1A14   EVER DO THINGS THAT COULD EASILY HAVE HURT YOU OR SOMEONE ELSE, LIKE SPEEDING OR DRIVING AFTER HAVING TOO MUCH TO DRINK 0.016527
S2AQ12F     HOW OFTEN DROVE MOTOR VEHICLE AFTER 3+ DRINKS IN LAST 12 MONTHS 0.016235
S10Q1A58FLIRT A LOT 0.015546
S3AQ3B2     USUAL FREQUENCY WHEN SMOKED CIGARS 0.014674
S2AQ9       HOW OFTEN DRANK 4+ DRINKS OF ANY ALCOHOL IN LAST 12 MONTHS (WOMEN ONLY) 0.014626
S9Q1A       EVER HAD 6+ MONTH PERIOD FELT TENSE/NERVOUS/WORRIED MOST OF TIME 0.014188
S11AQ1A22   EVER SHOPLIFT 0.014131
S10Q1A3     FIND IT HARD TO BE "OPEN" EVEN WITH PEOPLE YOU ARE CLOSE TO 0.013714
S10Q1A32   OFTEN GET ANGRY OR LASH OUT WHEN SOMEONE CRITICIZES OR INSULTS YOU 0.013670
S10Q1A46   TAKE LITTLE PLEASURE IN BEING WITH OTHERS 0.012579
S11AQ1A15   EVER GET MORE THAN 3 TICKETS FOR RECKLESS/CARELESS DRIVING, SPEEDING, OR CAUSING AN ACCIDENT 0.012403

The code and output is included below


Confusion Matrix: 
[[11983   892]
 [ 3540   823]]
Accuracy Score is:  0.742893607147

Monday, January 16, 2017

The quick and dirty on getting a Hadoop cluster up and running

The last time I tested out a hadoop cluster, it was about four years ago. At the time, the setup was manual and I used two machines to set up a two node cluster. I was able to run map reduce jobs and test the system out. Fast forward to 2017 - there are a lot more animals in the Hadoop circus and cloudera has made it very convenient by having various options to test - a quickstart VM, docker images etc. Still getting the system up and running and executing the first sqoop job took some effort. I have documented what I did including the tweaks so anyone running into the same can get help. Here are the steps:

  1. Get a system ready - at least 16GB or RAM. I had a Linux Mint box on hand that I used. Mint is generally similar to Ubuntu but you do have to watch out for version specific instructions. 
  2. The next step is to install Docker. For Linux Mint 18, the steps here from Simon Hardy came really handy.
  3. Cloudera provides a Docker Quickstart container - do not use that. There is a lot of documentation and links on that and its quite easy to go down that path. A better option is to use the Cloudera Clusterdock. Clusterdock is a multi-node cluster deployment on the same Docker host (by default it does a two node). The clusterdock documentation is very useful but there are a few catches that I will note here. There are few other links on clusterdock here:
    1. The cloudera online tutorial is based on the quickstart docker container or the quickstart VM. There are several dependencies including a mysql database, flume files that are used in the demo etc. I would suggest that you keep that container also around for a bit and copy the data as needed to the clusterdock nodes. The clusterdock setup is much more stable in the cloudera manager and the slight inconvenience (occasional hardware freezing) may be worth it. After launching the quickstart container, you may simply tar the /opt/examples folder and the mysql retail_db database and transfer that to the host machine using the docker cp command and then kill the quickstart container.
    2. The clusterdock.sh script on the cloudera website lacks 'sudo' in a couple of places. Be aware of that. Its easy to spot that in case it causes a problem. For example the ssh function has this problem.
    3. I wanted to run the sqoop command and for that I needed a myql database to connect to. There was one I installed on the host machine. It was almost impossible or looked very time consuming to connect the clusterdock containers to the host mysql. You run into a docker networking issue. The easy way out is to install a mysql docker container and put it on the same user defined network that the clusterdock nodes use. Note that you have to force the IP and the network on the mysql container to do that and also map the mysql port 3306 so its open for access. Else you will waste a lot of time!
  4. Next step is to ssh on the master node and run a sqoop job. At this time you will run into a lot of permissions issues if you are not careful with where you are storing the target imported files. sqoop will generally report exceptions stack trace with these permissions errors. Best is to google and fix the any paths you give to the sqoop command.
  5. You also need to copy the mysql jar file in the sqoop lib folders. Easiest way is to get it on the host box and then use the docker cp commands to move it to the desired location.
  6. That should do it - get you past the sqoop step and then you can run a query in Hue.

Saturday, January 14, 2017

Analyzing Gapminder Data


Founded in Stockholm by Ola Rosling, Anna Rosling Rönnlund and Hans Rosling, GapMinder is a non-profit venture promoting sustainable global development and achievement of the United Nations Millennium Development Goals. It seeks to increase the use and understanding of statistics about social, economic, and environmental development at local, national, and global levels. Since its conception in 2005, Gapminder has grown to include over 200 indicators, including gross domestic product, total employment rate, and estimated HIV prevalence. Gapminder contains data for all 192 UN members, aggregating data for Serbia and Montenegro. Additionally, it includes data for 24 other areas, generating a total of 215 areas.

GapMinder collects data from a handful of sources, including the Institute for Health Metrics and Evaulation, US Census Bureau’s International Database, United Nations Statistics Division, and the World Bank.

Decision tree analysis was performed (using python) to test nonlinear relationships among a series of explanatory variables (0-13 below) and a binary, categorical response variable (above average suicides per 100,000 in 2005). Note that python does not support pruning. The code is included below the analysis.


IndexVariable Description
X[0]income per person 2010 Gross Domestic Product per capita in constant 2000 US$
X[1]alcohol consumption 2008 alcohol consumption per adult (age 15+), 
X[2]armed forces rate Armed forces personnel (% of total labor force) 
X[3]breast cancer per 100th 2002 breast cancer new cases per 100,000 female
X[4]co2 emissions 2006 cumulative CO2 emission (metric tons)
X[5]female employment rate 2007 female employees age 15+ (% of population)
X[6]HIV rate 2009 estimated HIV Prevalence % - (Ages 15-49)
X[7]internet use rate 2010 Internet users (per 100 people)
X[8]oil per person 2010 oil Consumption per capita (tonnes per year and person)
X[9]polity score 2009 Democracy score (Polity)
X[10]residential electricity consumption per person 2008 residential electricity consumption, per person (kWh)
X[11]employment rate 2007 total employees age 15+ (% of population)
X[12]urban rate 2008 urban population (% of total)
responsesuicide per 100th Is the 2005 Suicide, age adjusted, per 100 000above average? (True or False)


Alcohol consumption was the first variable to separate the sample into two subgroups. The threshold was identified to be 16.19 litres and countries where it was higher than that had a likelihood of above average suicide rate. Next one was the amount of electricity consumed in residences. If the consumption was below 230 kwh, there was a likelihood of higher suicide rates. This was followed by armed forces rates - if less than 41% of the population was part of armed forces, the likelihood was higher. Alcohol consumption and employment rate comes next - higher amounts of alcohol consumption (higher than 14%) and a low employment rate (lower than 49%) had the likelihood of an above average suicide rate. Countries with low alcohol consumption (14%) and low female employment rates (less than 56%) had lower likelihood of a below average suicide rate. However, if this is combined with low internet use (lower than 85%) this led to likelihood of above average suicide rates.

The total model classified 64% of the sample correctly.


Thursday, June 6, 2013

Dumping Tomcat packets using tshark

Tshark (command line version of wireshark) is a wonderful tool for dumping packets and recently I used it on my Mac since I couldn't easily get Tomcat to log the HTTP packets coming in on port 8080. Having used it in the past for lots of other reasons, I felt compelled to find a generic solution to this problem where you have to rely on application level logging to determine why something works or doesn't.

Here is the command I used (lo0 is the loopback interface since I was running the client and server on my PC)

tshark -f "tcp port 8080" -i lo0 -V. Here is a very good page on tshark that I am sure I will come back to again and again to get more juice out of this tool.

Getting Postman to test Restlet

Postman is a wonderful Chrome application for testing REST method calls. However it was a bit hard to get it to work for testing Rest calls with my Restlet server. Here are the gotchas I faced and havent yet figured them out completely. I love to record them so I can come back much later and they are still here ;)

1. Postman does not add the Content-Type header by itself. If you select an HTTP method which allows a body (e.g POST), it allows you to create the body and select the format (JSON/XML etc) but you must remember to add the Content-Type header.
2. If your application requires authentication, you can add that too. Postman supports basic, digest as well as OAuth (which I would love to test out next).
3. The biggest problem I ran into was when I sent XML or JSON body and the Restlet server replied back with 415 - Unsupported Media Type. The request does not even hit my application side! If you write a client application and choose the Media Type of MediaType.APPLICATION_XML and the server side method is annotated by @Post("txt:xml") it works. However, when you set the Content-Type header in Postman to application/xml it does not work. To debug this further, I installed wireshark and dumped the packet contents. I was surprised to find that the client built using Restlet framework was sending a Content-Type header as text/plain. This had to be some issue on my end. Interestingly, if I made the corresponding changes in Postman, the request coming out from that application also started to work. These are the two headers I inserted. Note that a Content-Type of text/plain still does not work. You must indicate the charset as well to make it work.

Content-Type: text/plain; charset=UTF-8
Accept: application/xml


Tuesday, April 9, 2013

AD Authentication with SVN

Frequently with SVN, you would want to integrate with Active Directory to enable users to use their Windows Login and Password with SVN. Here is how you do it:


The Apache module to use in this case is the mod_auth_sspi. Once you have enabled that, set the SSPI configuration section in subversion.conf. the SSPIDomain should be set to the name of the domain you want to authenticate with.

When a user logs into SVN, the user ID they type into the SVN Authentication prompt is the Windows Account (without the domain) and the password is the domain password.

This may not be enough for you if you are using bugzilla integration with SVN using SCMBug. Bugzilla has an integration with AD (which I personally have not used) with enough documentation around it. If you use it, then just change the SCMBug configuration file to pass through the user id from SVN to Bugzilla. I think that should work, but if you find some tweaking is necessary in SCMBug, just post it back in the comments section for this post. I will definitely appreciate it in my next gig!

Wednesday, April 3, 2013

Interesting case for var -> val conversion in Scala

While Scala supports imperative as well as functional style of programming, it recommends programming in the latter. One of the challenges I faced was getting rid of a counter in the following BFS (Breadth First) style recursion (mutable to immutable variable conversion). I wont go into specifics but rather look at the pattern to be used here:

def BFSCounter(money: Int, coins: List[Int]): Int = {
    var n = 0
    // termination checks
    for (// loop dependent on input parameters
        n += BFSCounter( ...)
    n
}

The above code launches multiple recursions in each call of BFSCounter and the variable n which maintains the count must be incremented and returned. 

The strategy to get rid of the mutable variable is to pass the counter from one call of BFSCounter to another.  To do that we must also make the calls to BFSCounter a constant (independent of variables or input parameters). This means understanding the traversal pattern, termination checks etc. The final code looks like the following:

def BFSCounter2(money: Int, coins: List[Int]): Int = {
    // termination checks
    val count1 = BFSCounter2(...0..)
    BFSCounter2(count1)
}

Note that you may be able to reduce the code to just one call to BFSCounter2 or maybe you will need three calls. The point is that the number of calls should be finite and the counter is passed into the BFSCounter2 and passed back out as return value. The last call's return value is the final return value of the function.

Scala: Parameter-less functions

Scala has a few tripping points for newbies and one of them is parameter-less functions which look just like variable names or field names. I came across a very interesting example when researching the difference between def and val in Scala:

Scala has three ways to define a variable, method name or object:
  • def defines a method
  • val defines a fixed value (which cannot be modified - these are like Java final variables)
  • var defines a variable (which can be modified later). These are discouraged in Scala since they are mutable and are indicative that the program is using an imperative style of programming.
Consider the following example which may fool you (from this question on stackoverflow):

class Person(val name:String,var age:Int )
def person =new Person("Kumar",12) 
person.age=20 
println(person.age)

These lines of code give output as 12. ALWAYS. The reason is that "def person" creates a function definition instead of an object. Thus each time you write person in the code, it refers to a brand new Person object created by the person method. This happens in the assignment as well as the println code!


Another example from the "Programming in Scala, 2nd Edition" - If a function literal
consists of one statement that takes a single argument, you need not explicitly
name and specify the argument. Thus, the following code works and println looks like the name of variable in this case:

args.foreach(println)

Scala: Call by Name

Functional languages typically implement the call by name evaluation strategy natively. There are some special use cases where such an evaluation strategy may boost performance and one of the examples was given here.

The case  in consideration is how log statements within code can be made more efficient while being clean. Typically log level determines if the log statement actually does something in the code. 

For example, lets say you wanted to put the following log statement in the code:

logger.info("ok" + "to" + "concatenate" + "string" + "to" + "log" +"message")

If the check for the log level is done inside the log method, then by the time the check is done, the string concatenation would already have been performed. That would lead to bad performance. So the solution would be to wrap the code above with a check on the log level:

if (logger.isEnabledFor(Logger.INFO)) {
    // Ok to log now.
    logger.info("ok" + "to" + "concatenate" + "string" + "to" + "log" +"message");
}

In a language like Scala, this would be achieved by using a call by name argument to the logger method. The call by name argument is evaluated (pretty much like a parameter-less function call) only when needed. It is different from a lazy evaluation in that it is evaluated each time it is needed (call it lazy with no memory!).

Here is the code quoted from the above article:

def log(level: Level, message: => String) = if (logger.level.intValue >= level.intValue) logger.log(level, msg)

Another excellent example can be seen here.


Friday, March 1, 2013

Mapping IIS worker processes to pools

Once in a while you have to diagnose memory or performance issues with .NET applications. The first indication comes from the Windows task manager which may indicate a process hogging the CPU/memory or users may complain of excessive slowness. In my particular case, I recently examined an IIS6 worker process which was spinning at 20% and using 1GB of memory on a 32 bit Windows 2003 Server. Combine with user complaints that the system was extremely slow and unresponsive, it was something to look into. The investigation is still ongoing, but I am documenting the steps taken so far.

Step #1: Find out which application or applications are causing the problem. Using the process ID from the task manager, you can use one of the following methods depending on whether this is IIS6 or IIS7
  1. On II7 the IIS Manager gives an option to locate running worker processes, the pools they belong to and the requests they are currently processing right from the GUI. 
  2. On II6, this can get a little tricky. A little VB Script can be of help: IISApp.vbs. Since it is typically found in the system folders, you can pretty much run it directly from the command tool. Note that this script won't be found on IIS7 installs.

Step #2: The next step typically is to start tracking performance counters and see which ones may indicate problems. From the command prompt, type "perfmon". Using perfmon, you can turn on different performance counters. The slowness can be due to a variety of reasons. There could be a queue which is getting very long - a processor or network queue for example or system is doing too many context switches or there are too many interrupts or .NET garbage collection could be going on. The important point is to pick a place to start and find patterns. For example, I noticed that the processor queue length was relatively high and the context switches were very high in the system. The next step, it seemed to me was to try and isolate the process threads which were switching in and out and what was causing them to block so the OS would switch the thread out.

Perfmon shows multiple instances of the same process with suffixes like "#1", '#2' etc. This is not very helpful and brings us to Step #3 meanwhile in the digging process:

Step #3 The following article from Microsoft describes how to fix perfmon to print process IDs instead.

http://support.microsoft.com/kb/281884

Monday, February 18, 2013

Scripting on Linux

One of the best user contributed collections on unix scripting, available at The Linux Documentation Project. This has lots of illustrative and sometimes idiosyncratic examples which are better suited to learning than any other online site.

Friday, February 8, 2013

Inno Setup: Creating a scheduled Log Rotator

Setting up a rotation mechanism for log files on a Windows machine can be an interesting problem. This could be real easy on Linux using CRON but on Windows you may find the a tool called waRmZip (download from sourceforge or look at http://winadmin.forret.com/) very useful. It works very well and you can set up a scheduler job to fire it at a predetermined time. To do this kind of thing in Inno Setup, use the code below:

function GetDoLogRotateTaskAddParams(Default: String):String;
begin
  // This will use the Operation System SYSTEM account for running the task
  result := '/Create /RL HIGHEST /F /TN "MODULE Log Rotate" /SC DAILY /ST 23:59 /RU "" /TR "' + ExpandConstant('{sys}\cscript.exe \"{#InstallHomeDir}\Tools\waRmZip.wsf\" C:\Logs /gt:1MB /ma:1 /md:\"C:\Logs\Backup-$DAY\" /q');
  if Length(LogDeleteTime) > 0 then begin
    result := result + ' /da:'+LogDeleteTime;
  end;
  result := result + '"';  
end;

This assumes that the waRmZip is installed using the following command:

Source: waRmZip.wsf; DestDir: {#InstallHomeDir}\Tools;

A Task scheduler can be created using the following "Run" command in Inno Setup:

Filename: "schtasks.exe"; Parameters: "{code:GetDoLogRotateTaskAddParams}"; Description: " Log Rotate Task"; Flags: runhidden; Check: GetDoLogRotateTask;

Automating FTP using WinSCP scripting

The tool WINSCP can be used for scripting ftp related tasks. These are especially useful in automating FTP related tasks in an installer. I am posting some sample code here which may be useful. The entire set of scripting capabilities can be obtained from the WINSCP website.

option batch on
option confirm off'
open ftp://:@
cd
put
close
bye

This script can then be invoked using the WINSCP.com command as below:

Winscp.com /console /script=