Friday, February 2, 2024

The conundrum with Generative AI

Generative AI presents very big opportunities but also carries many risks. We review the current risk mitigation strategies and explore where we could go next as an industry where all players must play their part to achieve the best potential of this technology.


Benefits of Generative AI 

Since 2022, there has been a 1000% increase in the use of Generative AI content on the internet. Some say the AI could be the biggest game changer in our fight against hunger and poverty while others claim that it could widen the gap between rich and poor. Time will tell and with AI, time moves faster than other technologies we have experienced before - in just a few months, many industries have already embraced Generative AI at different depths to introduce enhanced products. For example:


1.     Using publicly available pre-trained AI Models: Grammarly, SciSummary and Legalyze are some of the companies using Generative AI to enhance their products with better interfaces and newer capabilities.

2.     Self-trained AI Models: BloombergGPT , Meta’s SeamlessM4T, Tabnine are some of the examples where companies have spent a lot more resources to train generative AI models on their own custom corpus to build tools which function better in their domains.

3.     Generative AI for Audio, Video and Imagery: Meta’s Audiocraft, Eleven Lab’s Dubbing Studio, and Video generators from Synthesia and Deepbrain are some examples.


Risks

Clearly, Generative AI has numerous benefits. So, what is the conundrum here?  While Generative AI can solve many hard problems, it also presents a clear and present danger to our society and way of life: Generative AI has been become the killer app for spammers, fraudsters, and misinformation spreaders. It has become a winning tool for politicians, especially where winning is important but extremely difficult or expensive due to regulatory environment. Several recent examples have emerged:


1.     An AI generated voice recording on Facebook was used to disrupted elections in Slovakia. 

2.     Politicians in Argentina used AI tools like Midjourney to generate fake images of rivals to influence voters. Politicians also claimed to be victimized by attackers that used Generative AI when in fact the information was as real and credible as it could be.

3.     Robocalls using an AI voice resembling President Joe Biden urged democratic primary voters to skip.


Current Solutions

Social media platforms have resorted to a mix of solutions ranging from automated detection tools to crowdsourced content moderation and fact checkers. For example:


1.     Meta uses fact checking organizations like Demagog and StopFake

2.     X uses CommunityNotes, an approved set of volunteers.


However, research shows these solutions have much lower efficacy in the political domain. First, the speed of response at the required scale does not match the viral speed at which the attack spreads. Second, seeking out consensus across divergent perspectives in a polarized political environment can be a daunting challenge for fact checkers too. The links I provided in the above examples in fact indicate many such limitations.


How do we address the gaps in 2024?


What can we do to address the possibility that there could be much more magnified versions of these attacks that may undermine political events in 2024?


The approach to solving this must be multi-pronged. 


Step 1: Improved legislative stance against tech and media companies to increase ethical accountability.


The general technology for Generative AI is mostly open sourced and well known in the research community. However, tech and media companies are the dominant enablers of such technology to the masses. By making it harder for the tech companies to ignore their ethical responsibilities, we can build a strong foundation for a comprehensive solution. The legislative actions taken in Europe, US, Canada and many other countries on AI Governance, Risk Framework and Compliance are very good examples of how this is being achieved.


Step 2: Use technology to ensure fast and accurate detection of Generative AI in digital content.


Generative AI content is mostly produced and consumed inside applications and devices that have capabilities to mark and verify that content. Examples:


1.     Applications that generate media like photoshop, Audiocraft and Synthesia.

2.     Social networks that host media like Facebook, Instagram and X.

3.     Applications that consume media like Web Browsers, Youtube and other mobile apps


The next step would be to improve how these applications can secure digital content and alert recipients as quickly and reliably as possible to the presence of generative AI. Here we can use at least three techniques:


1.     Watermarking: Watermarking involves hiding a label, sound or text inside the media and obscuring it so it is hard to detect. Such techniques are much more effective with images and video than text and can be used in applications that generate or modify media. There is absolutely no harm in generating watermarks within these applications. However, since generative AI is mostly open source, hackers and spammers can circumvent watermarking by using alternate services/training their own models.

2.     Pattern Detection: Tools like SynthID and GPTZero use pattern detection to identify generative AI content like text and images. Such tools can be integrated in Social Networks and Browsers. Care must be taken to constantly improve these tools and account for errors as Generative AI will continue to evolve and become better and evading detection.

3.     Coalition for Content Provenance and Authenticity (C2PA): C2PA is the most promising option as it presents a fast, reliable, and yet accurate way compared to other options. C2PA can be used to add cryptographic information to detect the tampering of media files and streams. C2PA is an open standard that focuses on providing the history and context for any digital media. This technology is very similar to X.509 certificates used by websites and payment services. Just like a certificate owned by a website allows a browser to verify the authenticity of the website and its owner, C2PA helps consumers identify who created a digital file and its complete modification history. Examples of applications that already implement C2PA include Adobe Photoshop and a Chrome extension released by Digimarc that can help consumers check images. C2PA can also be used along with blockchain technologies to certify the authenticity of images for news organizations.


C2PA has built-in safeguards (including PKI-based digital signatures) to ensure that the authorship or origin information is accurate and can’t be faked or falsified. C2PA has been available as early as 2022 and but its adoption is still very weak. Government intervention may be an option to accelerate adoption across the industry.


In conclusion, while Generative AI presents extraordinary benefits, it is imperative to address its associated risks through comprehensive strategies involving technology and policy in addition to just public awareness.

Sunday, May 6, 2018

The real impact of the All of Us Program

Today, May 6, happens to be the national launch day for NIH's All of Us program. This is a program that focuses on precision medicine - an emerging approach for disease treatment and prevention that takes into account individual variability in genes, environment, and lifestyle for each person (definition from NIH).

Precision medicine is not a new concept. If you google for it, you can find several documented cases, especially in cancer treatment where genomic information of a single patient was used to specifically target his or her disease successfully. The Director of the All of Us program, Eric Dishman happens to be such a case and is the kind of leader the program needs to make sure everyone can make use of it.

Using the genomic data to precisely understand and define medical treatment for an individual seems logical. But how can we generalize this and make its reach wider? How can the treatment of one person at one end of the world have a positive impact on a patient at another end? How can we connect the dots? Can we broker the innovation produced by Facebook to socially engineer the ad targeting into our own healthcare? Can we target medicines or health treatments to an audience instead of ads?

The answer is of course a resounding YES. It is resounding enough to reveal that All of Us is not the first program to attempt to do so. So why would it be more successful than other data collection programs? It has many good things going on for it. Besides large national funding and a passionate team that is behind it, it attempts to engage community, capture diversity and use all available technology.

As I wrote in my previous article, the power of using data to help complement today's medicine is huge. The All of Us program extends the scope of this power to come from a much wider data source. This is the data collected from a lot of people and a lot of types of data besides just genomic data. It targets not just patients but also healthy people. So why is all of this necessary if we can just take someone's genome and use it to tweak their treatment. Think of what Facebook does by collecting large amounts of data from a large set of people having diverse behavior. Think of how Alexa learns to do some smart things by learning from questions asked by a large number of people. Perhaps a quick lesson from machine learning would be useful here.

Machine learning from data involves looking for patterns when trying to see why certain choices or events or input parameters led to a set of outcomes. Finding the patterns needs diversity of data, else machine learning can go very very wrong. Data which is skewed towards certain outcomes can lead to very poor models. In addition, the presence of redundant inputs or the absence of key inputs can lead to poor models too. Having too little data is also not helpful and can lead to failed models in real world. Data scientists often combine the results of many models that are based on many sets of data to build a more real world robust model. 

That is precisely why the program attempts to collect a diverse set of data from a diverse set of healthy and non-healthy individuals and make it available to a diverse set of researchers. This could fundamentally change how medicine works in a few years. Think of how much machine learning technologies have impacted our day to day work in the last ten years. And how cheap it has become to research and deliver the benefits! Very simple health related outcomes could be achieved in the next couple of years itself. More complex cloud based solutions that use this data to buy health benefit programs "as a service" could evolve in few years!

Saturday, May 5, 2018

So really what is the All of Us Research Program?

Saturday today and I was stopped in my tracks to finish my chores several times. Tomorrow (Sunday) is the big launch. The big launch of what, they asked? They were messaging me all over the place on social media. Just google it, I said.

It finally is here - the big day, May 6 where NIH is engaged in the national launch of the program that has been in gestation so far for several months with thousands of beta participants. The program aims to enroll one million participants to volunteer their data and other information so researchers can use it to improve medicine.

I had no idea of this program until the middle of last year when I came across Vibrent (based in NoVA) and met its CEO, Dr Praduman Jain who later went on to explain the benefits and goals of Precision Medicine very passionately to me. And then it finally dawned on me. 

Well that was then. Fast forward almost four months and here we are. We have been so busy building up the functionality and infrastructure for the program that it has been all to easy to forget what the program is about!

A few months ago, I read an article by Chris Anderson, former editor in chief of Wired magazine, that I thought applied very well here: “The end of theory: the data deluge makes the scientific method obsolete” (http://archive.wired.com/science/discoveries/magazine/16-07/pb_theory/). As the title indicates, Anderson asserted that in the era of petabyte information and supercomputing, the traditional, hypothesis‐driven scientific method would become obsolete. No more theories or hypotheses, no more discussions whether the experimental results refute or support the original hypotheses. In this new era, what counts are sophisticated algorithms and statistical tools to sift through a massive amount of data to find information that could be turned into knowledge (source: NIH).

The All of Us Research Program can be instrumental in this process. Today, scientific research happens in the laboratory. A sample or specimen is observed, tests developed and then trials are done before getting approvals and mass rollout. This is still the wide majority of cases. Behavioral scientists have obviously been using data for their research regularly and there are few cases where actual patient data was used to build out a specific medicine formula that was then given to them. The All of Us Research Program has the potential not only to lower the costs of research in medicine but also to increase the efficacy of medicine.

Consider the long tail problem in developing medicines. The All of Us Research program can have a huge impact on solving this issue. If I was to give an analogy, this program has the ability to do what fiber optic cables did for the internet. I am not talking about the stock market crash of 1999 ! I am referring to the immense large possibilities of breaking down and then solving a very complex and large problem. Imagine what kind of collaboration you could get if this kind of data is available across national boundaries and what if it can be used and compared on demand by researchers all over the globe? This could completely democratize the problem of finding cures for diseases and help develop a very competitive market for medicines in the next 20-30 years. Hopefully that happens in my lifetime!

PS: This blog describes my person viewpoint on the All of Us Program. For the official definition or for signing up for the program, please visit the NIH Join All of Us website or download the apps from the App Store or Play Store. If you are interested in the crazy engineering that goes behind building this, join Vibrent Health. We are on the lookout for passionate (and crazy) engineers that want to change the world.

Tuesday, July 18, 2017

Can our payment institutions innovate?

Banks earning season is rolling in with Q2/2017 earnings. Most major banks including Bank of America, Wells Fargo, Goldman Sachs etc have lowered their guidance for the rest of the year citing lots of reasons - trading, market making, interest rates etc. Mortgage and lending business is also under pressure it seems. The same time Netflix reported record consumer growth in Q2/2017 while also suggesting strong negative free cash flows for the suggestible future. The market was happy at that and sent the stock surging. Its just part of doing business, right? That just sounds too bad for U.S banks which are considered fundamental pillars of the economy. Fundamental enough that taxpayers bailed them out few years back but still not allowed to innovate.

Bitter truth is that innovation in core parts of the economy can make the economy unstable. Innovation implies risk and risk can materialize once in a while. So we allow innovation to happen on the fringes of the economy. Fringe enough that if we loose it, not many people would notice.

Back to FinTech or Innovation in financial services. In the U.S/EU FinTech is helping evolve micro-lending and online banking industries. The pace is much more rapid in the developing parts of the world though, like Africa. However, we may be surprised to hear that U.S is a laggard when it comes to financial innovation. The reason is not that innovators in the U.S are not smart enough - but they simply focus on other important problems like talking robots, space travel and auto driving cars.

So what is going on with FinTech that should worry us? Here is a news flash - China is fast becoming the new FinTech capital of the world, taking that title away from the western world. The transactions volumes processed by Baidu, Tencent and Alibaba are growing so fast that they are set to pass the volumes Visa and Mastercard process in Europe and US in 2017. China's mobile payment system is does not use any high-technology though. It uses bar codes to process payments! Thats way inferior and insecure than the system used by Mastercard and Visa (EMVCO) or by Google/Applepay. One thing it gets right though - its fast, convenient and cheap and thats what matters. It has connected about a billion people in China who never had any bank accounts or credit history before. So why should we be worried? Chinese companies are slowly importing this system into U.S and EU through partnerships and deals with processors like Stripe and companies like AirBnB etc. They are so big and powerful that U.S companies have little choice accommodating them. That would slowly cut into the western financial system and would cause a huge disruption in the economies in the next ten years.

What can we learn from the success of the Chinese system? First, it processes transactions without communicating with the banks each time. If the amount of the transaction has a limit and the replication is fast enough, this should work. The result is that this makes it very fast for high volume processing.  It is cheap and convenient because there is no need to have expensive NFC hardware or scanning devices or chips/cards. Compare that with the our system - there are two banks involved. We use a dedicated transmission network for the payments and there are middlemen involved. More middlemen mean more fees and commissions including the need to keep reconciling data as it passes all the intermediate systems. Chip cards make things even slower. Evolution in our system is not going to be easy since the credit card companies have a tight grip on end users with rewards and points systems.

What can save us from certain failure is the need for innovation - the U.S still has around 50 million people without bank accounts and thus no credit cards. PayNearMe tapped into this market by offering an easy way to make cash based payments where credit cards were not an option. So who is going to get to it first!

How social networking combined with NLP analytics is helping expand the economy

Recently I have been researching the rise of NLP again. This was the topic of my bachelor thesis in 1995, almost 20 years ago and it has now become a hot area of research again in the last 5 years. The science and tools have evolved and a lot of new open source tools like NLTK are available for researchers.

Clearly the early users of social networking data were doing a lot of sentiment analysis on it to determine trends for companies, products, politics etc. Things have changed now - governments are interested in scouring billions of bytes of data generated daily in social networks for intelligence hints, Fin-Tech upstarts are starting to successfully use the same data to disrupt financial services - for example, the lending industry. 

The sale of Troo.ly to Airbnb spiked my interest into this. Research revealed the existence of a whole bunch of companies and existing patents in the science of using social network data to determine a person's trust or risk score. Appears that lot of tricks have evolved in the last five years. However, this is quite scary as well! In the next few years, I can see a lot of people trying to use this score instead of just pulling the credit scores in business transactions. This could be landlords, people selling goods on craigslist (e.g cars etc), small business engaging in seasonal hiring to keep costs low. It could certainly replace simple background checks. While this is all great, the scary part is that this presents a Kafkian situation for people at the other end of it. Unlike their FICO scores, there is a lot less visibility into how the machine learning algorithms work. Imagine a customer service rep trying to explain why your social risk was considered too high when renting an apartment for a few days on AirBnB.

This led me to findings how the big Chinese payment companies (Ant Financial, Baidu) are now planning to use all the data that they collect from repeated payment transactions and the social networks they own to determine credit scores of people. This idea is definitely not new but it is breaking new ground in the last couple of years. For example, companies like HelloSoda, Guardian Analytics have been doing risk scoring for quite some time now. There are also a lot of banking and lending upstarts in U.S and EU - Kabbage, Simple, Moven, Fidor etc. However, FinTech has taken social networking data to a new level now and this time its not just to send marketing and sales offers (like the famous American Express examples show) or to make your banking very cool indeed. 

There are multiple innovation areas - companies like Jumo have made a significant penetration in the underbanked markets of Africa to enable micro-lending based on social networking data that they collect. In China, Baidu already has more than 10% of its assets involved in some kind of lending, the biggest being in the education market. Now Alibaba and Tencent are also getting involved. Not only is the mobile payments market in China set to pass the transactions Visa and Mastercard process but it is also spinning out new uses of the data collected. In one way it looks like social networking companies may have an edge over managing risk and may have slowly started to disintermediate traditional lending companies. There are 800 million people using Tencent for payments that have no credit history with the central bank and the daily transaction patterns reflect a lot about their behavior and risk. Take a look at AutoGravity - users can not only select cars, schedule a test drive but once they connect it to their social networking account, the site also prefills the application, verifies identity and lines up four lending companies without having the user fill up scores of forms or go to an office. All on the mobile phone in minutes. Facebook, Google and Apple could be doing this next year. It all starts by focusing on an underserved market and there are enough in financial services - there are almost 64M Americans without sufficient credit history and almost 2B people around the world without a bank account.

Thursday, July 6, 2017

Learning TensorFlow

TensorFlow is Google's deep learning library, released in 2015. In many ways, it may be puzzling why we should pay attention to it given there are so many machine learning frameworks around that seem to be doing a pretty good job so far!

The following should provide a good motivation:

- TensorFlow supports GPUs.
- TensorFlow supports distributed computation
- Primarily TensorFlow is good for deep learning. Lets just say it seems to be much more focused on DL.

Note that TensorFlow is equivalent to the numpy module in python. There is a lot of development still going on and hopefully easy to use libraries like scikit-learn will be available soon. One may also ask that Apache Spark provides distributed computation, has an ML library and supports GPUs as well. So why not just use Spark by itself? The answer may be that Spark is not focused on DL as much as TF is. Moreover the distributed computation model of Spark is very different from TensorFlow. Spark has a resource manager hidden from the user that parallelizes an RDD computation over a cluster. TensorFlow distributed programming involves the user and the program has a lot more control on the computation. IMO, Spark may sit in the data pipeline ahead of TensorFlow to massage/clean and process data that is used to train a very large neural network. At this point, TensorFlow needs a considerable simplification of its cluster management and programming API before it can be used by data scientists used to working with tools like numpy/R or Spark.

Here are some good talks and links to understand TensorFlow better:


Monday, May 15, 2017

Why Logistic Regression is linear even though it uses a non linear function

Logistic Regression uses a non linear activation function - the logistic function:

\[z = \frac{1}{(1 + e^{-y})}\]

where $\textit{y}$ is linear in $\textit{x}$, the input variable.

Note that this is equivalent to:

\[z = \frac{e^{y}}{(1 + e^{y})}\]

So why is logistic regression considered linear and the result used for classification rather than predicting a continuous output? Having more of a computer science background, this was something that did not initially catch my eye. This related post made it quite easy for me to understand logistic regression. Here I provide some key points related to logistic regression and some references from a theoretical perspective to help develop a better understanding:
  • Logistic function is used to give the probability of the output being in a binary class. Its output is always between 0 and 1 given any value of inputs in any number of dimensions.
  • If you rearrange the logistic function, the natural log of the odds (the ratios of probabilities of an event being successful and unsuccessful) is the familiar linear regression equation. The reason why logistic regression is considered linear is that we are combining the outputs using a linear function.
  • The tanh function, which is a mathematical function of the logistic function is a better choice than logistic function since it has steeper gradient. The steeper gradient is better in backprop training. A steeper gradient passes back feedback from output back to input much faster and having a larger impact on weights closer to input nodes making convergence faster.
  • While logistic regression works very well in binary classification for any number of dimensions, the softmax function is a much better choice for in multi-class classification. The softmax sums up to one in a multi-class situation over all the classes. The logistic function does not have this property. 
  • In a binary classification, using a softmax function is equivalent to using the sigmoid function.
  • One may ask why use these complicated exponential functions in the output? If we want probability, we can simply use an average - divide each output by the sum of outputs. The problem with this approach is that individual values can become negative even if they add to one. Exponentiating makes everything positive. Also, exponentiation works well for back propagation since it amplifies errors making algorithms converge faster.
  • The use of logistic function as an activation function inside the network also has an issue - the vanishing gradient problem which makes deep neural nets very hard to train. ReLU, y = max(x, 0), has been a popular choice since it does not alter the gradients as they are propagated back to the input. This nice blog entry provides a great explanation.
  • ReLU is also only used for hidden layers. Outputs would still be softmax (classification) or linear (regression).

Wednesday, May 10, 2017

Better ways to do One Hot Encoding

While running an ML algorithm on any data, you may have to convert categorical data into numerical data - reason is that a mostly all scikit-learn code requires you to input data which is numeric. Though one may think that it is a scikit limitation, that may not be true. Since ML uses math and vectors behind the scenes, the data has to be numerical for most good algorithms.

One of the common ways to convert categorical data to numeric data is using One Hot Encoding. This kind of encoding uses indicator variables, where each value of the category is replaced by a column of its own. This can lead to column explosion so one must be careful. A lot of times, categories that have an order can be mapped to numerical values that may be helpful as well. 

Several methods of One Hot Encoding have been mentioned. Most prominent and simple of them uses the get_dummies function in pandas:
In this function, we loop through all the categorical variables in the pandas dataframe one by one and for each case, we use get_dummies to create indicator variable columns (which are numeric) and then we delete the original categorical column. This is pretty simple and mostly this is what is recommended the most in forums. However, there are a few catches with this method in practice:

  1. The categorical variable may have different sets of values in training, validation and test data. If you run get_dummies, it may assign the same numeric value to different categorical values. When fed into the ML algorithm this can cause unintended data alternation and results.
  2. The order in which the categorical values are encountered by get_dummies may further contribute to the above issue
  3. Some categorical values may only appear in validation and test data and may be absent in training data. This can cause more problems. Training a model on one kind of values and then testing predictions on another may not make sense. The get_dummies does not help identify this problem. 
The best course of action is to map the categorical values to a set of indicator variables and then use the same set during test and validation. This should not be changed. In addition, if certain categorical values that are going to be seen in practice in validation or test data, we must take that into account. We will leave this specific problem to another post. In this post, lets see how we can fix get_dummies to at least fix the first two problems and alert us of the third one.

Python provides few other alternatives that are a bit complex to use but I feel are totally necessary. One of these uses the LabelEncoder function. LabelEncoder looks at a categorical variable and creates a transformation which maps the values to integer labels. This does not create any indicator variables so one may think is inadequate for our needs. However, what LabelEncoder does is store the mapping as a model which can be used repeatedly later on. Combining LabelEncoder with get_dummies provides the ideal solution:
So what's up with the dictionary and the train variable in this function? Note our initial objective - we must use the same mapping for both the training and test data. The python dictionary holds important storage area for the mappings created by the LabelEncoder for each column in a dataframe. The call made to this function for training data looks as follows:

train_data, le_dict = oneHotEncode2(train_data)

Then on the test data, the call is made by passing the dictionary returned back from training:

test_data, _ = oneHotEncode2(test_data, le_dict)

The call to an already created transform for encoding also checks to see if it encounters any new values in the test data. If it does, it will warn us and we can go back and take appropriate action.

Monday, May 8, 2017

Hail Seaborn!

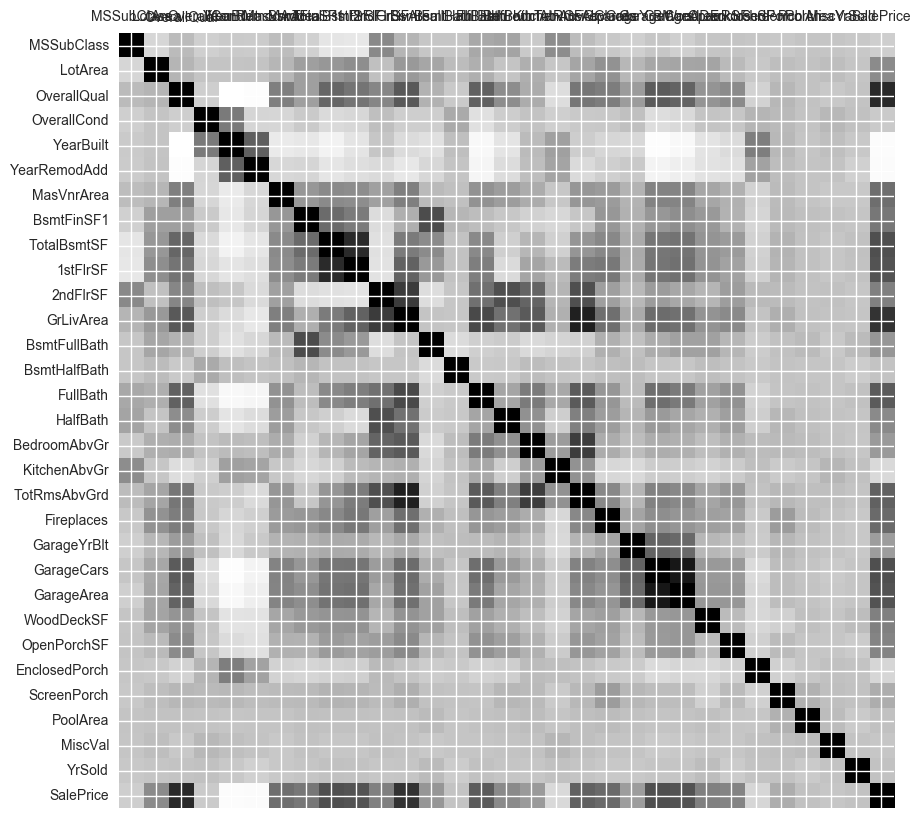
The seaborn heatmap perhaps is the best visualization of the correlations in a data set.


 Much better than Axes.matshow():


Analyzing Predictions to find *bugs*

Testing should be one of the most frequent steps in the SDLC for any code, whether it is building a website, powering a smart device or machine learning. Tests of machine learning code may reveal lots of issues - transformations that don't work because the right columns are not operated on or data which fails assumptions of the learning algorithm. The list may be endless and we are well attuned to this process. One of the tests often ignored is comparing the test results during the training period with actual values from the data and then trying to find what went wrong and where. This can often reveal attributes or column values that you may have ignored till now and must play a bigger role.

For example, use the following function to plot test results against the real values. The plot should be a straight line. Any deviations from it are to be analyzed for every column.


Make your test data comply with training data

When using scikit-learn libraries with pandas, you would often get errors if the test data does not have columns which match the model created from the training data set. You may have deleted columns that you did not need from the training data when creating the model or you may have constructed new columns based on existing data variables (for example, creating 'Age' from 'Date' or combining the effects of multiple variables). In most cases, this is simple to achieve by wringing the test data through the same function as the training data. However, when you are using One-Hot-Encoding of categorical data, the columns created as a result of this coding in the training set and the test set may not match for the simple reason that some values for categorical data may only be present in the training data set and others may be present only in the test data set. I have included here a python function that I wrote and works really well to match the test data with the training data:


Thursday, January 26, 2017

K-Means Cluster Analysis on Outlook on Life Survey Data

The Outlook on Life Survey (OOL) was designed to study political and social attitudes in the United States. The project included two surveys fielded between August and December 2012 using a sample from an Internet panel. A total of 2,294 respondents participated in this study during Wave 1 and 1,601 were interviewed during Wave 2. There are 436 variables in this study.

Note that full access to data archive is available for members on the ICPSR site.

Our goal in this study is to do a K-Means Cluster Analysis to determine if there is a set of variables we can identify that can measure how angry people feel about the way things are going in the country these days (W1_B4).

The variables we selected as the cluster variables are:

Variable Description
W1_H1       Society has reached the point where Blacks and Whites have equal opportunities for achievement
W1_O5       [Black people should teach their children to be careful around the police] How much emphasis or de-emphasis should Black people place on each statement in the education of their children?
PPINCIMP   Household Income
W1_F4_D         [To become wealthy ] For yourself and people like you, how easy or hard is it to reach these goals?
W1_F6       How far along the road to your American Dream do you think you will ultimately get on a 10-point scale where 1 is not far at all and 10 nearly there?
W1_M5     How often do you attend religious services?


We are going to validate our clusters by excluding the variable W1_B4 (Description - Generally speaking, how angry do you feel about the way things are going in the country these days?) from our analysis. We would treat this variable as a measure and we expect to see some differences on this variable amongst our clusters.

While doing the cluster analysis we noticed the following: (a) In some cases, when more data was included for determining the clusters or the cluster analysis was repeated, we observed that the cluster means for our measure variable came quite close. In addition, if the number of clusters we wanted was increased, that also had an impact on the cluster means and the significance of the difference amongst the cluster means.

First, we ran a simulation trying to determine what the affect of clustering on the average distance of the points from centroids. For our analysis, we will go with three clusters. As we can see the choice of number of clusters is completely subjective. As the number of clusters increase, the average distance will decrease.


Here is the plot of the cluster after applying PCA to reduce the number of variable dimensions to two:


The split amongst the three clusters is (the cluster IDs are 0.0, 1.0 and 2.0)

0.0    419
2.0    355
1.0    348

Our next step is to try and fit a simple least squares line using W1_B4 as the dependent variable based on the cluster number we have determined for the points. The results of that are:


The mean and standard deviation for W1_B4 in the three clusters are:

cluster        
0.0      2.916468
1.0      3.129310
2.0      3.008451
standard deviations for W1_B4 by cluster
            W1_B4
cluster        
0.0      1.307026
1.0      1.192171
2.0      1.224716

Because we had more than two clusters, we decided to conduct a tukey test to determine which one of the two means had significant difference. It seems that cluster 0.0 and cluster 1.0 had means that were significantly different (led to rejection of the null hypothesis).


Then we analyzed the two clusters are the means of the different cluster variables within those clusters.

The following is the mean of the various clustering variables in their respective clusters:


W1_B4 mean is lower for cluster 0.0 indicating that people in cluster 0.0 are generally more angry about the situation in the country than those in cluster 1.0 (lower values in the survey correspond to higher anger felt by the respondent). Then we try to look deeper into the cluster variable means. We find that W1_F4_D is lower for cluster 0.0. Lower value indicates that the respondents think that it is hard to become wealthy in this country. A lower value of W1_H1 (in cluster 0.0) indicates that the respondents agree much more that blacks and whites have equal opportunities for achievement. A lower value of W1_M5 for cluster 0.0 also indicates that respondents attend religious services more frequently there. A higher value for W1_05 for cluster 0.0 indicates that respondents place a strong emphasis that black people should teach their children to be careful around the police in the education of their children. Cluster 0.0 also has lower average household income.

So what can we establish - it seems that the likelihood that a person is going to be unhappy about the situation in this country is going to be higher when their income is lower and they generally do not believe that their wealth can significantly increase in this country (even though they believe that blacks and whites have equal opportunities). The higher likelihood seems connected with lower income, more religious bent of mind and general wariness of law enforcement.

The code is included below:


Sunday, January 22, 2017

Lasso Regression for U.S. National Epidemiological Survey on Alcohol and Related Conditions (NESARC) data

Background on the data used here (NESARC) was described in an earlier post in this blog. In that post, we conducted a Random Forest analysis for the boolean response variable: EVER GAMBLED 5+ TIMES IN ANY ONE YEAR (S12Q1). In this post we conduct Lasso Regression for the same. Before we dive into the analysis, there were some interesting observations about using Lasso, which performs linear regression for a response variable. When this response variable has an integer value vs a boolean we get different results. When we use a boolean variable, the results are quite similar to the Random Forest analysis which also used a boolean response variable. However, if we use an integer value for the response variable, which makes more sense to use in a linear regression (e.g Lasso where MSE is calculated), the list of important variables detected are different from those reported by Random Forest. This requires more analysis.

The following variables (listed below in order of importance) were identified as the most important since their coefficients were the largest in absolute values in this regression. We can compare the coefficients since we scaled the input variables to zero mean and unit variance. The most important variables identified in this analysis were: whether the individual had panic attacks (S6Q1) or was engaged in reckless driving (S11AQ1A15) or was not too open with anyone including those close to him/her (S10Q1A3). The rest of the variables are mentioned as well. The variables whose coefficient was reported to be zero by Lasso are briefly mentioned below as well.


Variable Description Coefficients
S6Q1       HAD PANIC ATTACK, SUDDENLY FELT FRIGHTENED/OVERWHELMED/NERVOUS AS IF IN GREAT DANGER BUT WERE NOT 0.226163
S11AQ1A15   EVER GET MORE THAN 3 TICKETS FOR RECKLESS/CARELESS DRIVING, SPEEDING, OR CAUSING AN ACCIDENT 0.175727
S10Q1A3     FIND IT HARD TO BE "OPEN" EVEN WITH PEOPLE YOU ARE CLOSE TO 0.125577
S11AQ1A25   EVER DO SOMETHING YOU COULD HAVE BEEN ARRESTED FOR, REGARDLESS OF WHETHER YOU WERE CAUGHT OR NOT 0.085541
S11AQ1A2   EVER STAY OUT LATE AT NIGHT EVEN THOUGH PARENTS TOLD YOU TO STAY HOME 0.068325
S11AQ1A22   EVER SHOPLIFT 0.067515
S11AQ1A1   OFTEN CUT CLASS, NOT GO TO CLASS OR GO TO SCHOOL AND LEAVE WITHOUT PERMISSION 0.067146
S11AQ1A14   EVER DO THINGS THAT COULD EASILY HAVE HURT YOU OR SOMEONE ELSE, LIKE SPEEDING OR DRIVING AFTER HAVING TOO MUCH TO DRINK 0.054445
S9Q1A       EVER HAD 6+ MONTH PERIOD FELT TENSE/NERVOUS/WORRIED MOST OF TIME 0.047805
S10Q1A16   THE KIND OF PERSON WHO FOCUSES ON DETAILS/ORDER/ORGANIZATION OR LIKES TO MAKE LISTS AND SCHEDULES 0.047434
S1Q1G       NUMBER OF YEARS LIVED IN UNITED STATES -0.030454
SMOKER     TOBACCO USE STATUS 0.026548
S11BQ1     BLOOD/NATURAL FATHER EVER HAD BEHAVIOR PROBLEMS 0.024917
AGE         CYEAR (DATE OF INTERVIEW: YEAR) - DOBY (DATE OF BIRTH: YEAR) -0.024049
S2AQ5G     HOW OFTEN DRANK 5+ BEERS IN LAST 12 MONTHS 0.022640
S10Q1A25   HAVE OTHERS TOLD YOU THAT YOU ARE STUBBORN OR RIGID 0.019741
S3AQ3B2     USUAL FREQUENCY WHEN SMOKED CIGARS -0.015306
S1Q1D5     "WHITE" CHECKED IN MULTIRACE CODE -0.012658
S1Q10A     TOTAL PERSONAL INCOME IN LAST 12 MONTHS -0.012306
MARITAL     CURRENT MARITAL STATUS 0.011049
DGSTATUS   DRUG USE STATUS -0.009435
S3AQ3B1     USUAL FREQUENCY WHEN SMOKED CIGARETTES 0.008346
S1Q9B       OCCUPATION: CURRENT OR MOST RECENT JOB -0.007877
CHLD0_17   NUMBER OF CHILDREN UNDER AGE 18 IN HOUSEHOLD 0.007562
S2AQ10     HOW OFTEN DRANK ENOUGH TO FEEL INTOXICATED IN LAST 12 MONTHS -0.007253
S10Q1A43   ARE THERE VERY FEW PEOPLE YOU'RE REALLY CLOSE TO OUTSIDE OF IMMEDIATE FAMILY 0.007089

Variables reported with zero coefficents (these could be correlated with the variables mentioned above that have non-zero coefficents since Lasso would randomly end up picking one of the correlated variables) or unrelated with the response variable:


Variable Description Possible Explanation
S10Q1A52   THE SORT OF PERSON WHO DOESN'T CARE ABOUT WHAT PEOPLE THINK OF YOU Seems Correlated
S10Q1A58FLIRT A LOT Seems Correlated
S2AQ12F     HOW OFTEN DROVE MOTOR VEHICLE AFTER 3+ DRINKS IN LAST 12 MONTHS Seems Correlated
S10Q1A47   HAVE ALMOST ALWAYS PREFERRED TO DO THINGS ALONE RATHER THAN WITH OTHERS Seems Correlated
S10Q1A46   TAKE LITTLE PLEASURE IN BEING WITH OTHERS Seems Correlated
S10Q1A45   WOULD BE JUST HAPPY WITHOUT HAVING ANY CLOSE RELATIONSHIP Seems Correlated
S2AQ12B     HOW OFTEN DRANK AFTER MIDNIGHT IN LAST 12 MONTHS Seems Correlated
S10Q1A32   OFTEN GET ANGRY OR LASH OUT WHEN SOMEONE CRITICIZES OR INSULTS YOU Seems Correlated
S10Q1A22   HARD TO LET OTHERS HELP IF THEY DON'T AGREE TO DO THINGS EXACTLY THE WAY YOU WANT Seems Correlated
S2AQ9       HOW OFTEN DRANK 4+ DRINKS OF ANY ALCOHOL IN LAST 12 MONTHS (WOMEN ONLY) Seems Correlated
NUMPER18   NUMBER OF PERSONS 18 YEARS AND OLDER IN HOUSEHOLD Seems Unrrelated
NUMPERS     NUMBER OF PERSONS IN HOUSEHOLD Seems Correlated/Unrelated

The training and test R-square errors were reported as 0.670503947 and 0.66454160107 respectively which were fairly high indicating a good fit of the model with the training and test data. The training and test mean squared error was 0.474361978873 and 0.495379372341 respectively which was fairly low in both cases as well. The MSE plot is as follows and we can see that the MSE is successively going down as the alpha value increases.


The plot for the progression of the coefficients as the variables are added one-by-one in the Lasso Regression is show below.


Python code is included below:


Friday, January 20, 2017

Random Forest Analysis of U.S. National Epidemiological Survey on Alcohol and Related Conditions (NESARC) data

In 2001/2002, the National Institute on Alcohol Abuse and Alcoholism (NIAAA) conducted the National Epidemiologic Survey on Alcohol and Related Conditions (NESARC), the largest and most ambitious comorbidity (simultaneous presence of two chronic conditions in a patient) study ever conducted. In addition to an extensive battery of questions addressing present and past alcohol consumption, alcohol use disorders (AUDs), and utilization of alcohol treatment services, NESARC included similar sets of questions related to tobacco and illicit drug use (including nicotine dependence and drug use disorders).

The unprecedented sample size of NESARC (n = 43,093) made it possible to achieve stable estimates of even rare conditions. Moreover, its oversampling of Blacks and Hispanics as well as the inclusion of Hawaii and Alaska in its sampling frame yielded enough minority respondents to make NESARC an ideal vehicle for addressing the critical issue of race and/or ethnic disparities in comorbidity and access to health care services.

NESARC studies the occurrence of more than one psychological disorder or substance use disorder in the same person. In this analysis I have utilized the data collected in the survey for gambling and tried to determine its linkage to other predictors like alcoholic tendencies or drug use or other personality traits that can be detected. General information about the survey can be found here.

The following response variable was predicted: EVER GAMBLED 5+ TIMES IN ANY ONE YEAR (S12Q1).

The following variables (listed below in order of importance) were amongst those included as explanatory variables in Random Forest technique. The accuracy of the random forest was 74% with the maximum accuracy achievable with around 12 trees in the forest. Further increase in number of estimators (trees) did little to increase overall accuracy of the model. On closer examination of the variables found important by the model, we can see that an we can predict about the gambling tendencies of an individual by examining their alcohol consumption patterns, personality and drug use amongst other things.


Variable Description Score
S1Q1G       NUMBER OF YEARS LIVED IN UNITED STATES 0.059010
S1Q10A     TOTAL PERSONAL INCOME IN LAST 12 MONTHS 0.057991
AGE         CYEAR (DATE OF INTERVIEW: YEAR) - DOBY (DATE OF BIRTH: YEAR) 0.056678
S1Q1E       ORIGIN OR DESCENT 0.048400
S1Q9B       OCCUPATION: CURRENT OR MOST RECENT JOB 0.046075
BUILDTYP   TYPE OF BUILDING FOR HOUSEHOLD 0.036685
MARITAL     CURRENT MARITAL STATUS 0.029524
SMOKER     TOBACCO USE STATUS 0.028936
NUMPERS     NUMBER OF PERSONS IN HOUSEHOLD 0.027357
S2AQ12B     HOW OFTEN DRANK AFTER MIDNIGHT IN LAST 12 MONTHS 0.025185
S10Q1A52   THE SORT OF PERSON WHO DOESN'T CARE ABOUT WHAT PEOPLE THINK OF YOU 0.024643
S2AQ10     HOW OFTEN DRANK ENOUGH TO FEEL INTOXICATED IN LAST 12 MONTHS 0.024418
S10Q1A16   THE KIND OF PERSON WHO FOCUSES ON DETAILS/ORDER/ORGANIZATION OR LIKES TO MAKE LISTS AND SCHEDULES 0.023065
CHLD0_17   NUMBER OF CHILDREN UNDER AGE 18 IN HOUSEHOLD 0.022352
S10Q1A20   OTHERS THINK YOU HAVE UNREASONABLY HIGH STANDARDS/MORALS/IDEAS ABOUT RIGHT AND WRONG 0.022323
S10Q1A43   ARE THERE VERY FEW PEOPLE YOU'RE REALLY CLOSE TO OUTSIDE OF IMMEDIATE FAMILY 0.022088
S10Q1A25   HAVE OTHERS TOLD YOU THAT YOU ARE STUBBORN OR RIGID 0.021601
S11AQ1A2   EVER STAY OUT LATE AT NIGHT EVEN THOUGH PARENTS TOLD YOU TO STAY HOME 0.020961
NUMPER18   NUMBER OF PERSONS 18 YEARS AND OLDER IN HOUSEHOLD 0.020405
S11AQ1A1   OFTEN CUT CLASS, NOT GO TO CLASS OR GO TO SCHOOL AND LEAVE WITHOUT PERMISSION 0.020345
S10Q1A45   WOULD BE JUST HAPPY WITHOUT HAVING ANY CLOSE RELATIONSHIP 0.020180
NUMREL18   NUMBER OF RELATED PERSONS 18 YEARS AND OLDER IN HOUSEHOLD 0.019861
S2AQ5G     HOW OFTEN DRANK 5+ BEERS IN LAST 12 MONTHS 0.019397
S3AQ3B1     USUAL FREQUENCY WHEN SMOKED CIGARETTES 0.019338
S11BQ1     BLOOD/NATURAL FATHER EVER HAD BEHAVIOR PROBLEMS 0.018869
S10Q1A47   HAVE ALMOST ALWAYS PREFERRED TO DO THINGS ALONE RATHER THAN WITH OTHERS 0.018636
S11AQ1A25   EVER DO SOMETHING YOU COULD HAVE BEEN ARRESTED FOR, REGARDLESS OF WHETHER YOU WERE CAUGHT OR NOT 0.018017
S10Q1A22   HARD TO LET OTHERS HELP IF THEY DON'T AGREE TO DO THINGS EXACTLY THE WAY YOU WANT 0.017820
DGSTATUS   DRUG USE STATUS 0.017671
S1Q1D5     "WHITE" CHECKED IN MULTIRACE CODE 0.017200
S6Q1       HAD PANIC ATTACK, SUDDENLY FELT FRIGHTENED/OVERWHELMED/NERVOUS AS IF IN GREAT DANGER BUT WERE NOT 0.016674
S11AQ1A14   EVER DO THINGS THAT COULD EASILY HAVE HURT YOU OR SOMEONE ELSE, LIKE SPEEDING OR DRIVING AFTER HAVING TOO MUCH TO DRINK 0.016527
S2AQ12F     HOW OFTEN DROVE MOTOR VEHICLE AFTER 3+ DRINKS IN LAST 12 MONTHS 0.016235
S10Q1A58FLIRT A LOT 0.015546
S3AQ3B2     USUAL FREQUENCY WHEN SMOKED CIGARS 0.014674
S2AQ9       HOW OFTEN DRANK 4+ DRINKS OF ANY ALCOHOL IN LAST 12 MONTHS (WOMEN ONLY) 0.014626
S9Q1A       EVER HAD 6+ MONTH PERIOD FELT TENSE/NERVOUS/WORRIED MOST OF TIME 0.014188
S11AQ1A22   EVER SHOPLIFT 0.014131
S10Q1A3     FIND IT HARD TO BE "OPEN" EVEN WITH PEOPLE YOU ARE CLOSE TO 0.013714
S10Q1A32   OFTEN GET ANGRY OR LASH OUT WHEN SOMEONE CRITICIZES OR INSULTS YOU 0.013670
S10Q1A46   TAKE LITTLE PLEASURE IN BEING WITH OTHERS 0.012579
S11AQ1A15   EVER GET MORE THAN 3 TICKETS FOR RECKLESS/CARELESS DRIVING, SPEEDING, OR CAUSING AN ACCIDENT 0.012403

The code and output is included below


Confusion Matrix: 
[[11983   892]
 [ 3540   823]]
Accuracy Score is:  0.742893607147